Analyse your shot pattern and shooting performance
The total says how well. The pattern says why.
Shotmetrix turns every shot into usable data: trends, spread, heatmaps and per-shot statistics — automatically from your photo, printout or SCATT file.
- Group position and spread in millimetres — adjust or practise?
- Series by series: where does focus drop, where does it flow?
- Trend and personal bests per discipline and period.
Try it: drag the slider Sample result
Upload
How your shots get into the app.
You don’t have to enter anything by hand. However you normally shoot — the results are read in automatically.
Result sheet
Photo of the scoring machine printout — the AI reads series and single shots.
AI reads itTarget
Photo of the shot target — every hit is found and scored.
AI reads itRange QR code
Sport Quantum and other electronic ranges: scan the code, result is in.
SecondsSCATT
Upload the training file — with aiming trace, hold time and trigger behaviour.
With traceBy hand
No printout, no range system? Just type in your series.
Always worksMESHPRO Lasertarget
The Lasertarget can be connected to your Shotmetrix account — share finished rounds from there straight to your profile.
ConnectFiles from training
SCATT, ASAFA, Steyr SX: upload the file, done.
If you train with an aiming trainer or a sensor gun, upload the file instead of typing anything. Shotmetrix detects the format itself.
SCATT
.scatt · .scatt-basic · .scatt-expertAiming trace, hold time and trigger behaviour per shot — replayable in the shot viewer, plus the full evaluation with rings and shot pattern.
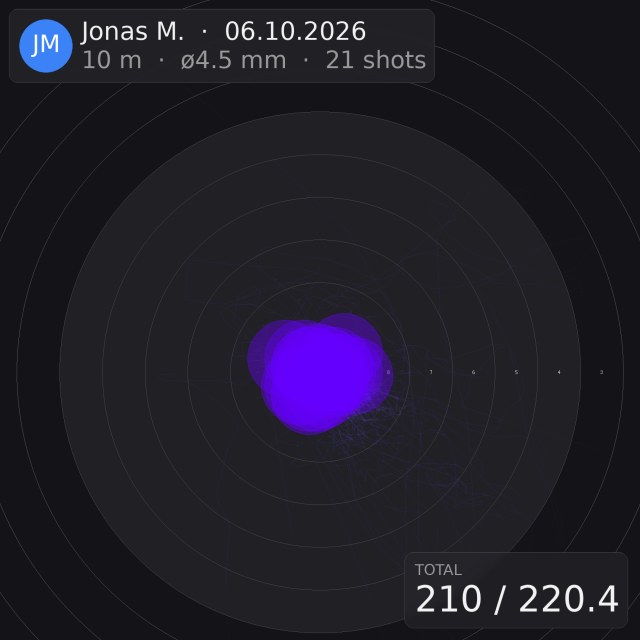 From the app
ASAFA
Camera trainer · XML exportThe aiming trace of every shot from the XML export, converted to the 10 m target: rings, decimals, best shot, trend and heatmap.
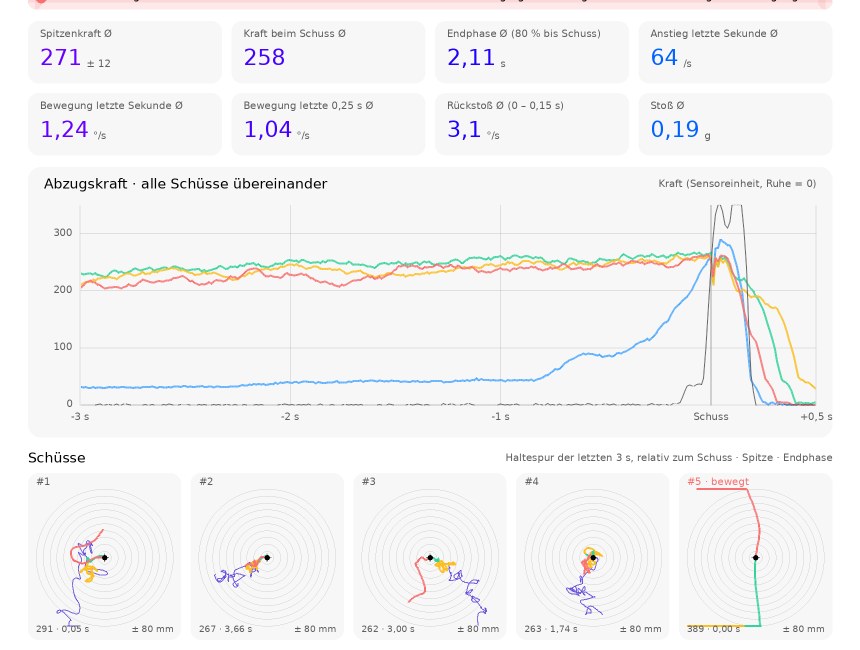 From the app
Steyr SX
EVO 10 E SX · .sss per shotTrigger force and movement of the gun: force curves of all shots overlaid, hold trace of the last seconds, figures per shot. No hit positions — the sensor sits on the gun.
Performance analysis
Every result counts. Your profile holds every analysis — filtered by discipline and period.
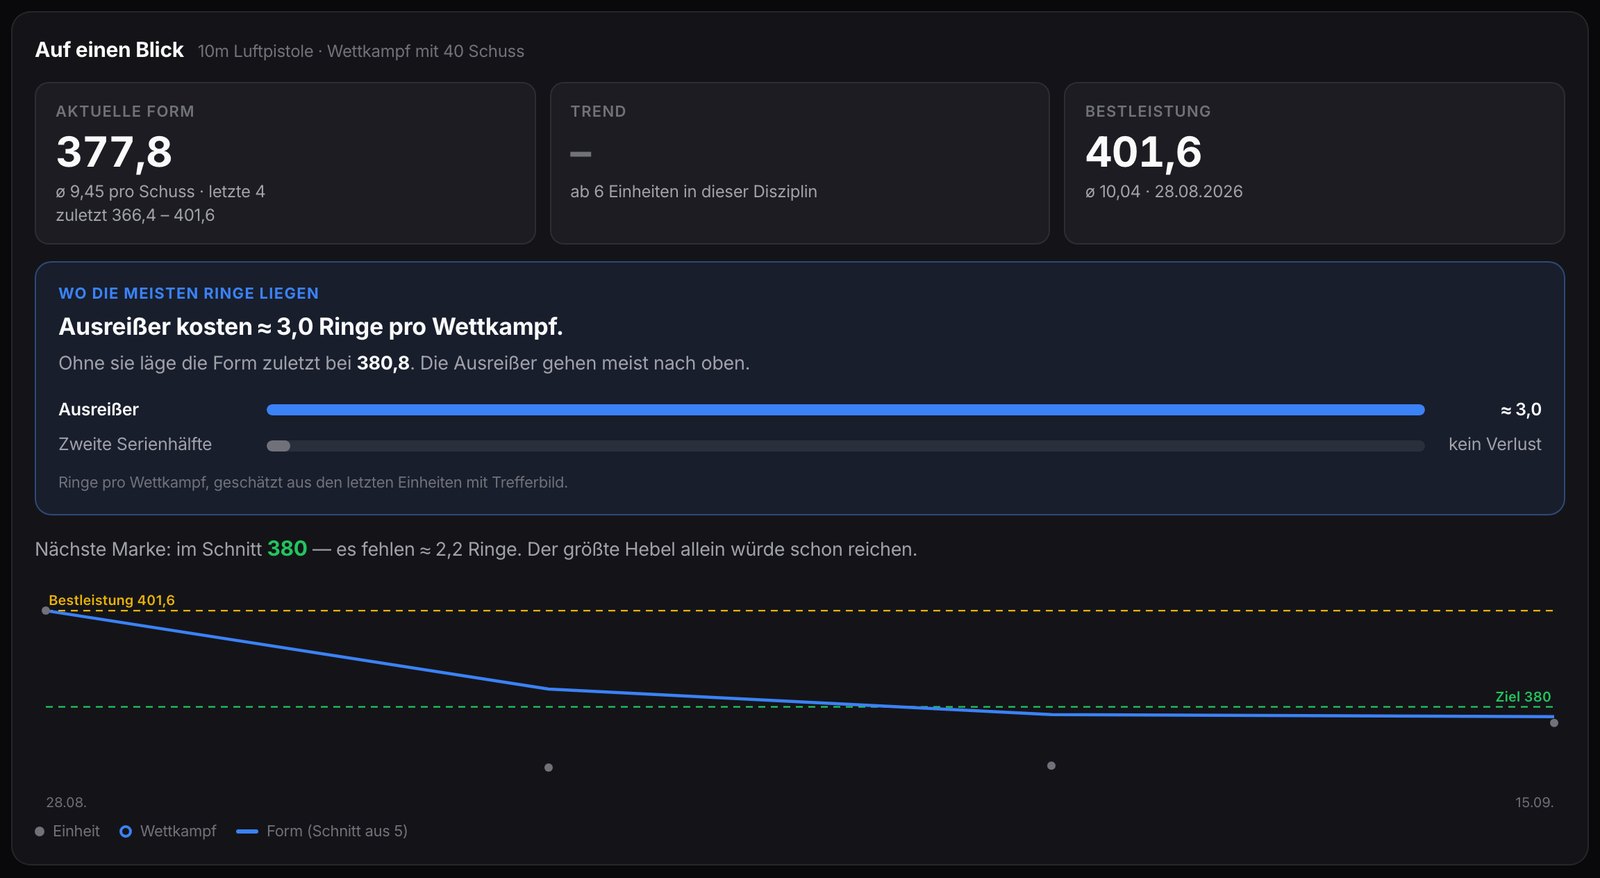
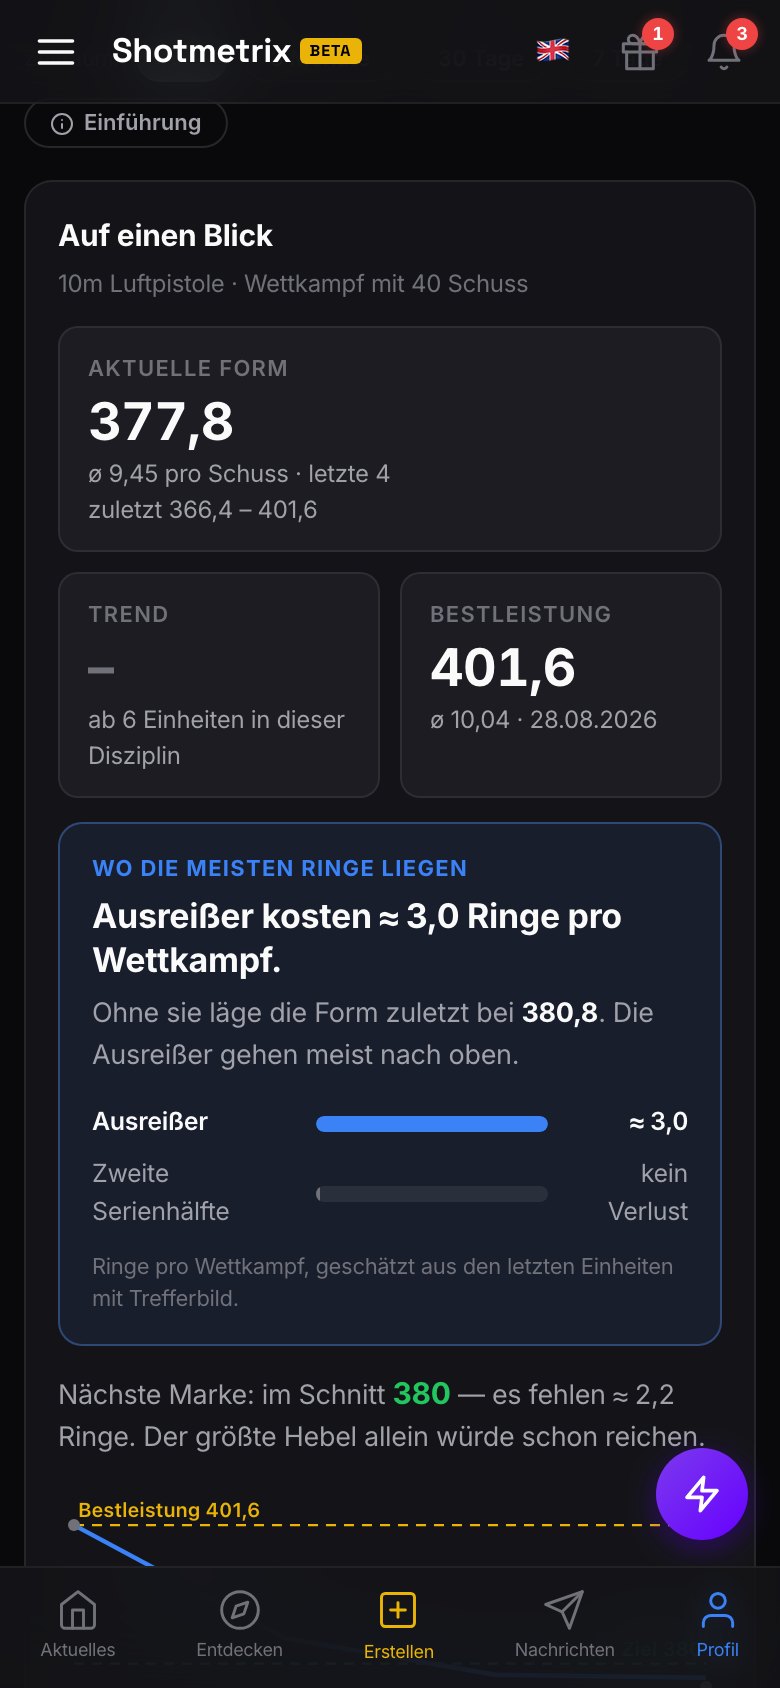
At a glance
Where you stand — and where the rings get lost.
At the top: current form, trend and personal best in match rings. Below, Shotmetrix works out what costs you most: outliers, group position or the second half — estimated in rings per match.
- Follows every filter (discipline, period).
- Next mark with the gap in rings.
- Form curve with personal-best and target line.
Outliers
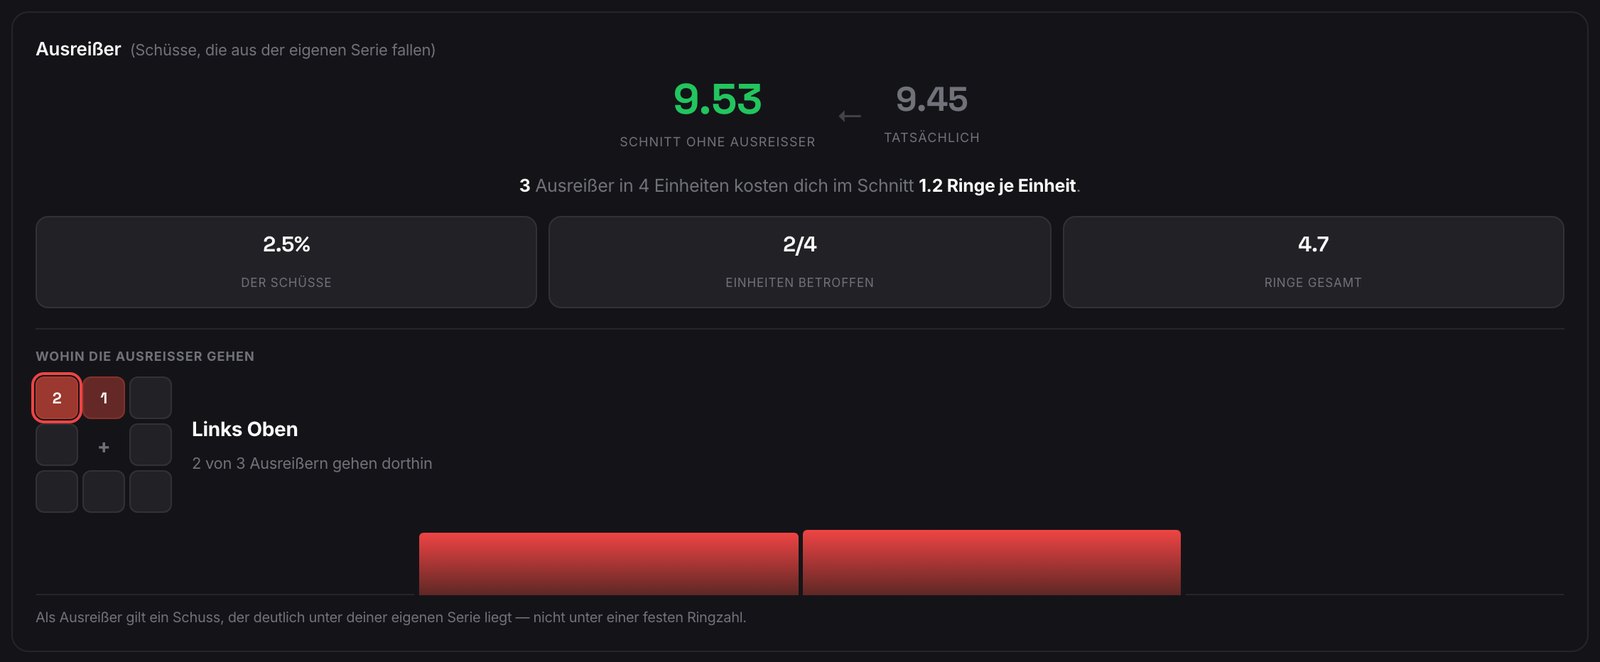
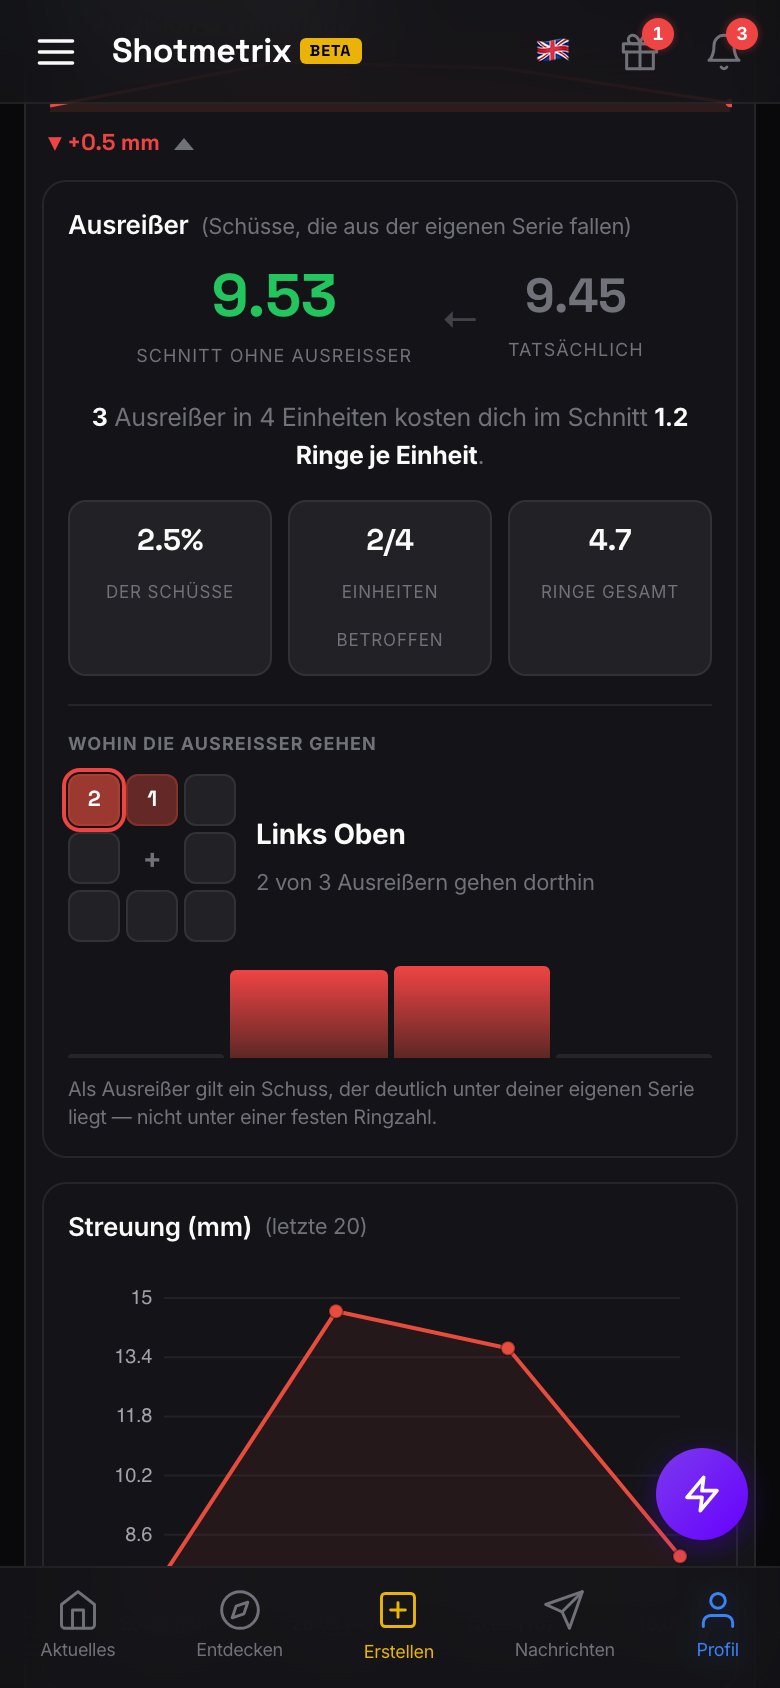
Your average without the slips.
An outlier is a shot clearly below your own series — not a fixed ring value. You see what they cost you per session and which way they go.
- Average with and without outliers side by side.
- Direction grid: high left, low right …
- Share of shots and sessions affected.
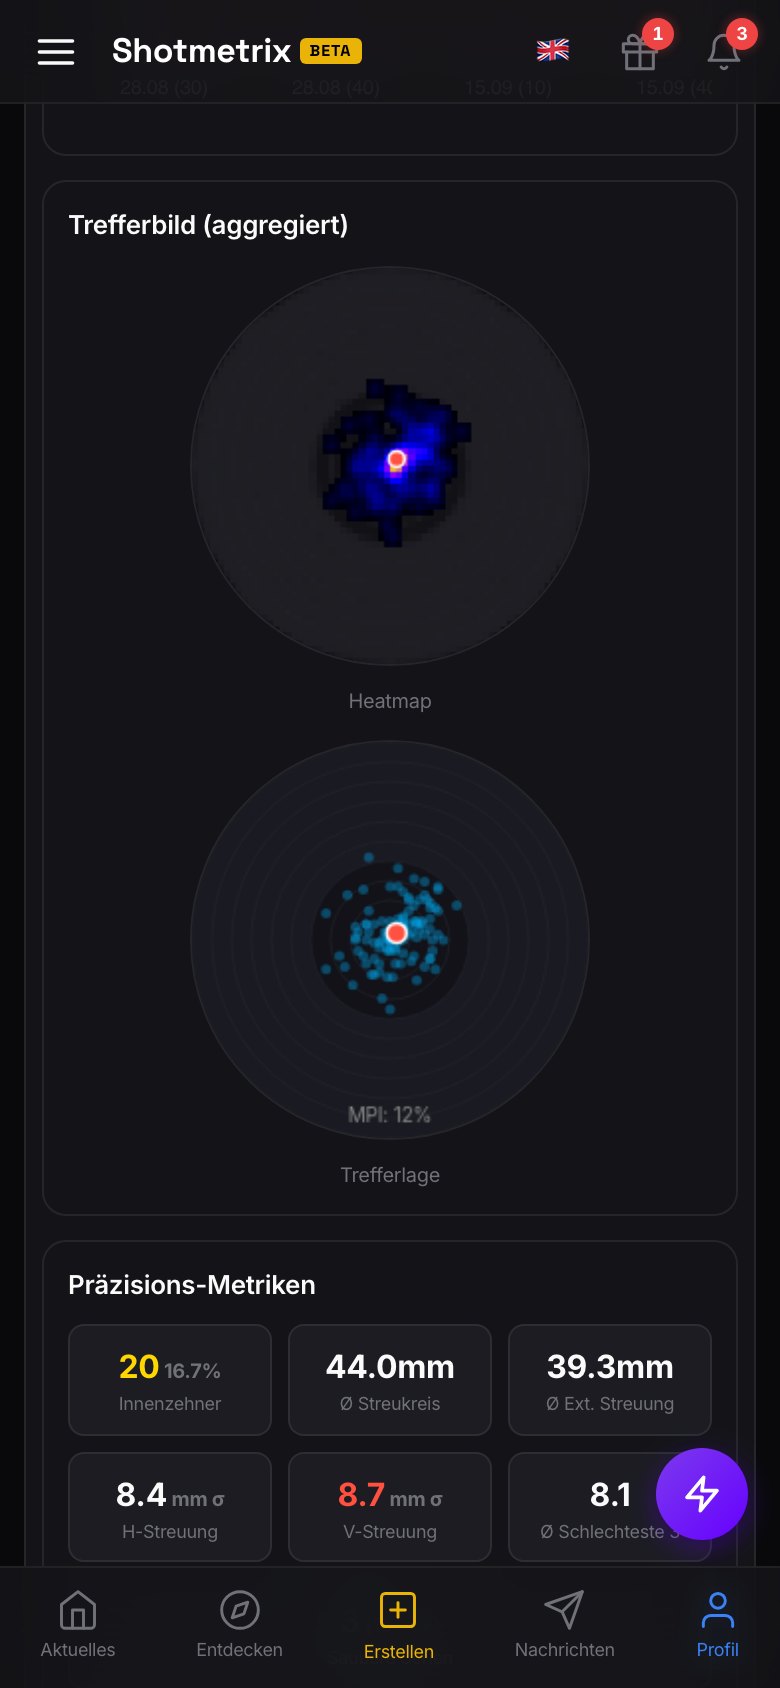
Pattern & group size
Adjust or practise?
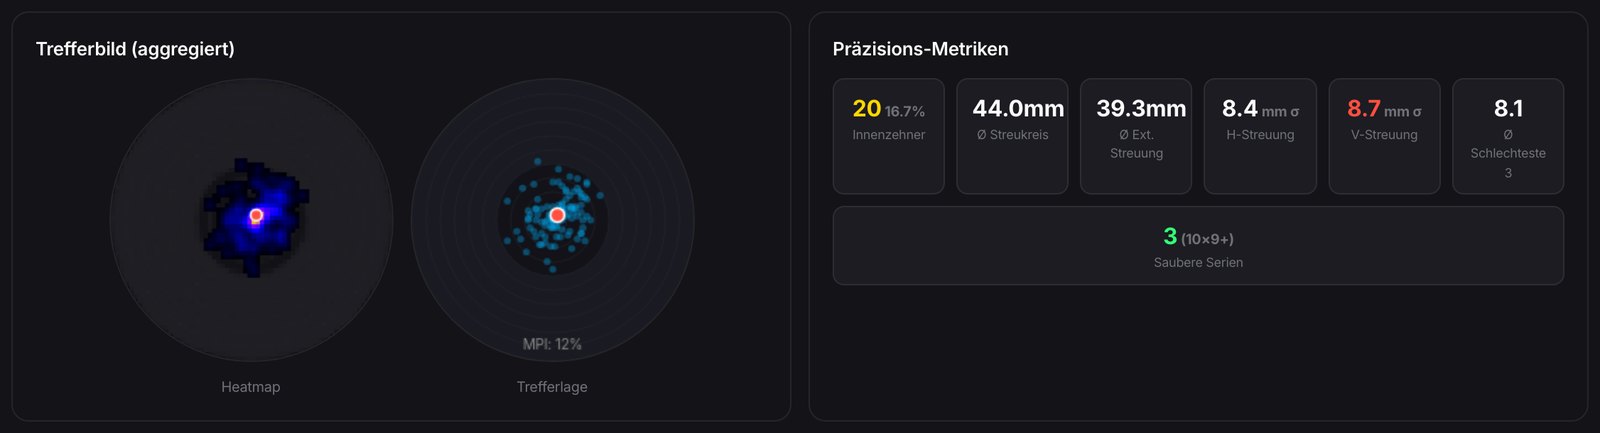
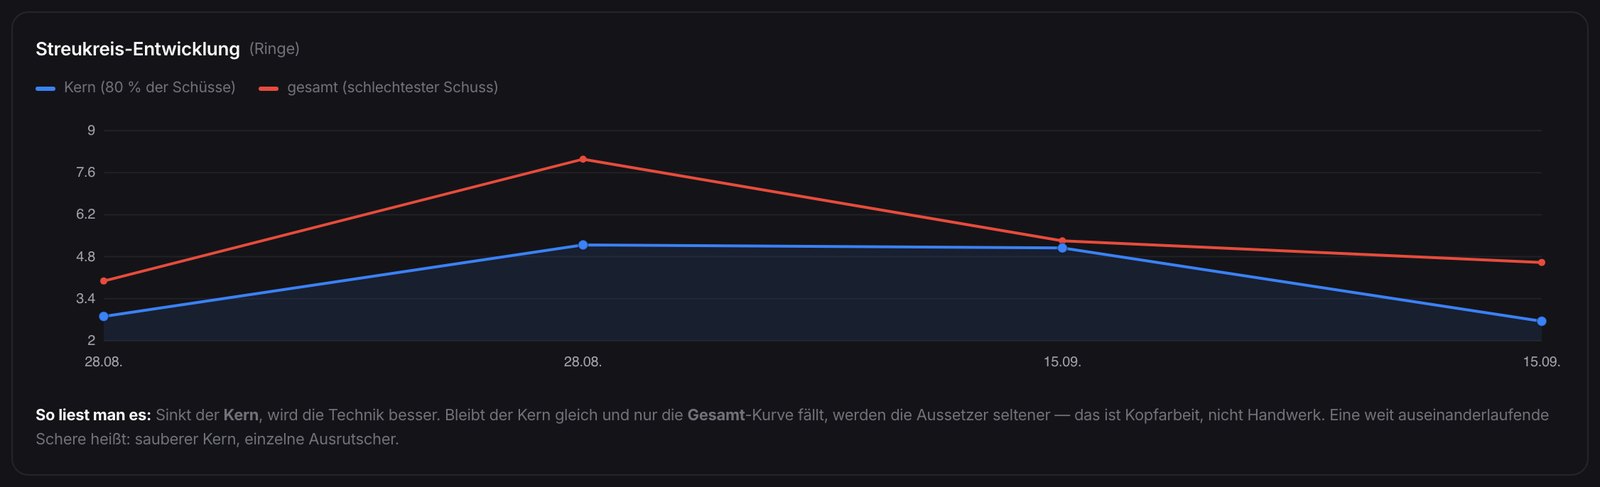
All shots layered: heatmap, mean point of impact and spread in millimetres. Below, core and total group size over time — a shrinking core means better technique; if only the total curve falls, the flyers are getting rarer.
- Group size, vertical and horizontal spread separately.
- Inner tens and clean series.
- Point of impact in percent from the centre.
Screenshots from the app in dark mode, with test data.
Interactive shot viewer
Click a post to open the shot viewer — your session, shot by shot.
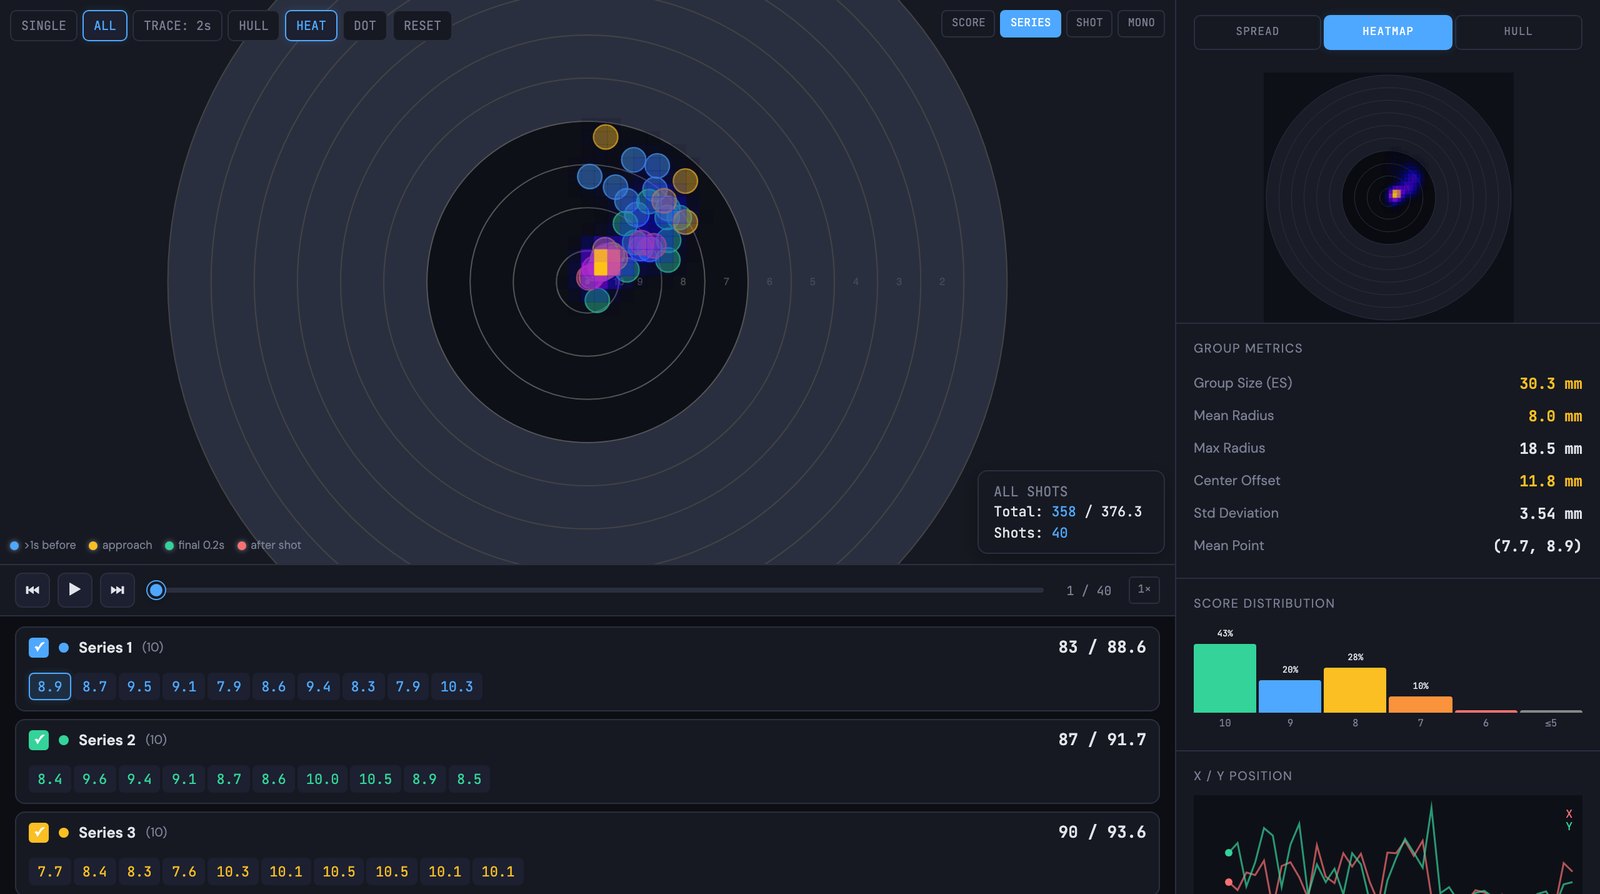
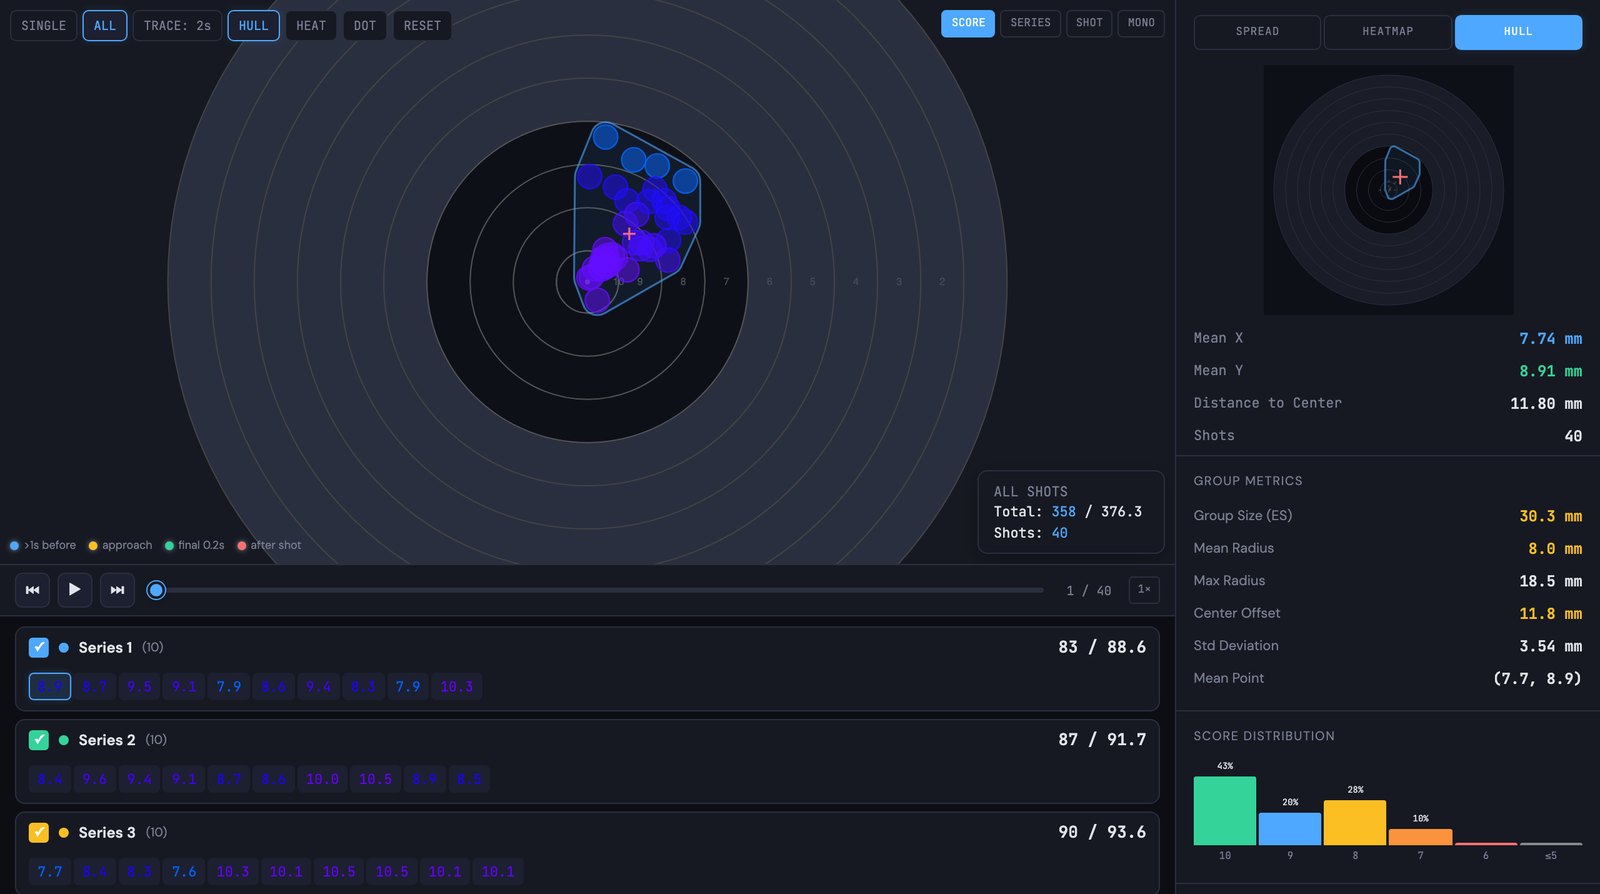
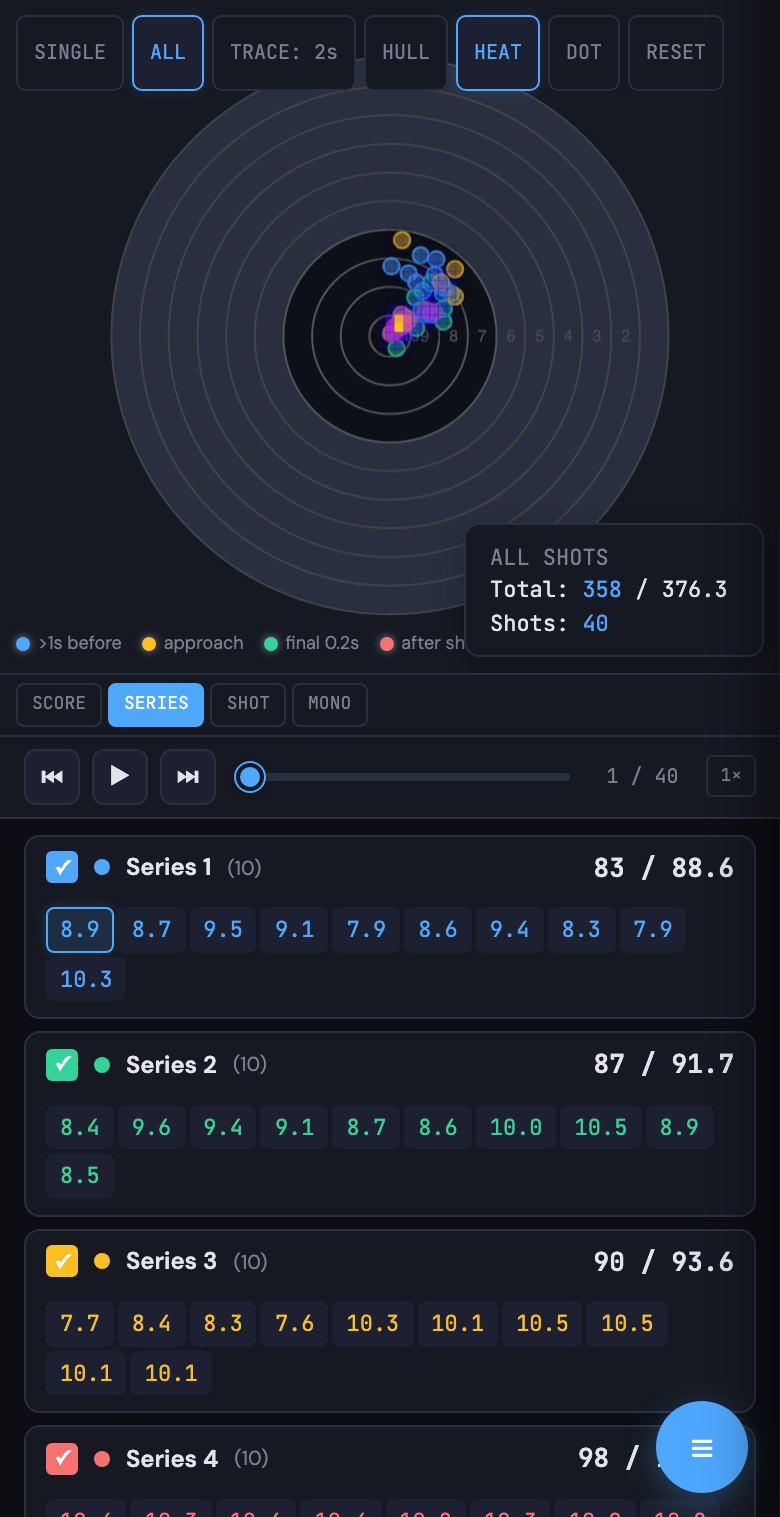
In the shot viewer you lay a heatmap or hull over the target, colour by value, series or single shot, and step through each series.
Screenshots from the app in dark mode, with test data.
Compare & community
Supported disciplines
Your discipline is missing? Let us know — and we will add it.
Ready to understand your shots?
Create a free account, upload your first result — and see the full analysis right away.